Site Selection: Scoring Models and the Cannibalization Check
Where should the next location open, and will it add new revenue or steal from stores you already own? A weighted scoring model builds the shortlist. Cannibalization analysis is the check that reorders it.
Where should the next location open, and will it add new revenue or pull revenue from stores you already own? Poor site selection is expensive: industry estimates put annual losses in the hundreds of billions to low trillions, locations opened in the wrong geography, against the wrong trade area profile.
Site selection is a scoring model, not intuition. You define the factors that correlate with performance at existing locations, weight them by historical predictive value, and apply the model to every candidate geography. The output is a ranked shortlist. Then cannibalization analysis tells you how many of those candidates would just steal from yourself.
This is the third in a three-part series on the GIS workflows that drive real business value, and it depends directly on the first: the cannibalization check at the end of this article is only possible if you have already built the polygons described in trade area analysis.
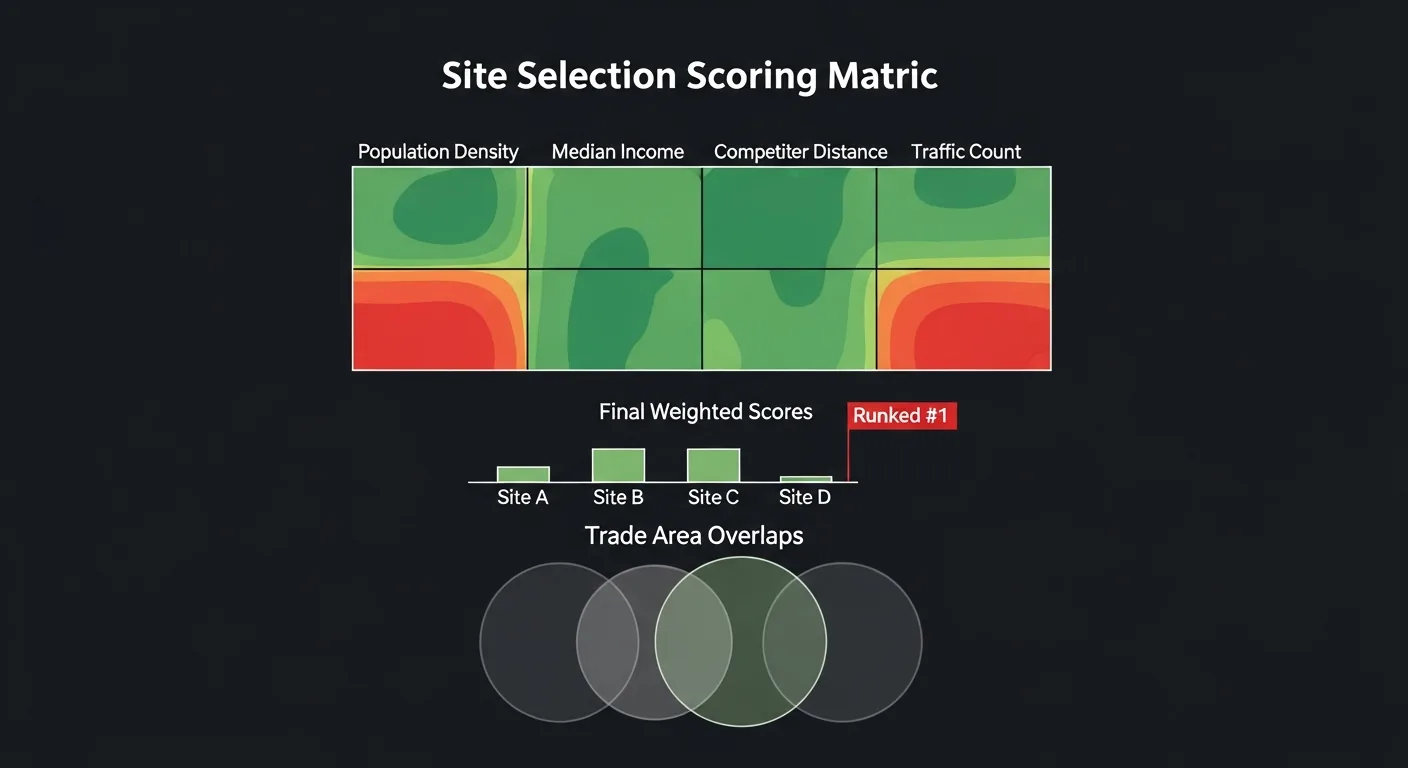
The Scoring Model
The process: apply the scoring model to a hex grid covering your target region. Each hexagon gets a composite score. Filter to the top decile and you have a shortlist of candidate geographies. Run cannibalization before presenting anything to leadership.
Two building blocks make this model possible. The factor columns come from spatial joins against demographic, competitor, and traffic layers, the pattern covered in Location as the Universal Foreign Key. And the hex grid itself is a custom spatial asset you build and maintain, the kind of work described in The Spatial Supply Chain.
Candidate Site Rankings
Scores are normalized 0 to 100 per factor, then weighted by their historical correlation with revenue at existing locations. The table below shows a typical result. Notice how Site A leads on population and traffic, but those are exactly the factors that signal it sits close to your existing stores.
| Candidate | Pop. Density | Income | Competitor Gap | Traffic | Score | Model Rank |
|---|---|---|---|---|---|---|
| Site A: Downtown North | 92 | 58 | 41 | 88 | 71 | #1 |
| Site B: Riverfront | 75 | 72 | 63 | 71 | 70 | #2 |
| Site C: Westgate | 61 | 85 | 79 | 55 | 69 | #3 |
| Site D: South County | 48 | 91 | 88 | 44 | 66 | #4 |
Weighted score: 30% population, 20% income, 25% competitor gap, 25% traffic. Weights derived from regression against existing location revenue.
Cannibalization: The Check That Changes Everything
Every new location draws from your existing trade areas. Sites that score highest on the model are often near your densest existing coverage, which is exactly why they score well. In dense networks it's common for a large share of a new location's projected revenue, sometimes on the order of 40 percent, to be redistribution from an existing site rather than growth. You need to run cannibalization before presenting any shortlist to leadership.
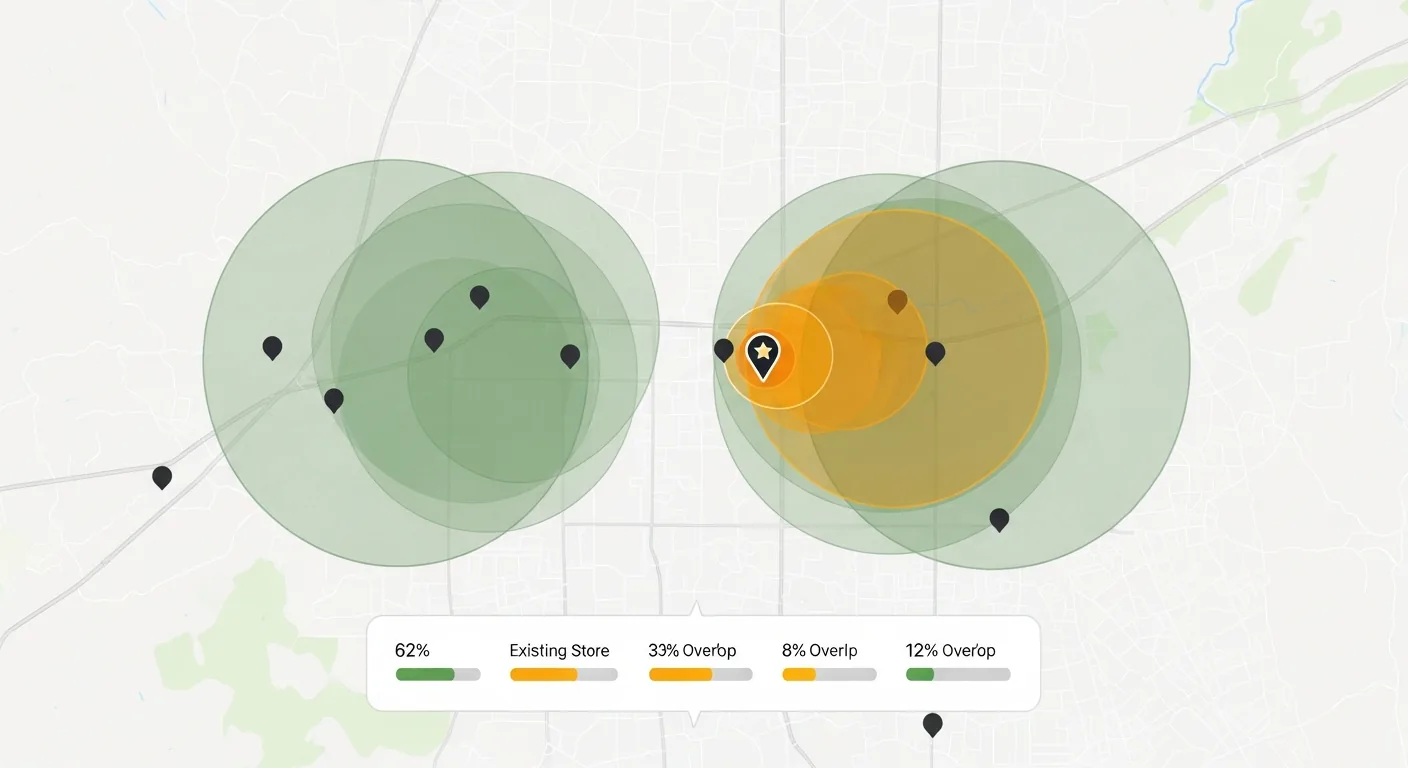
The mechanic is simple once the trade area polygons exist: intersect each candidate's projected trade area with the trade areas of existing stores, and report the overlap as a percentage. Here is what it does to the ranking from the previous section:
Opening here likely moves revenue from Store #4, not grows the network. This is the model's top pick, and the worst actual choice.
Moderate cannibalization risk. Majority of the trade area is new coverage, but worth monitoring Store #7 post-opening.
Additive revenue. New customer base with strong income and competitor gap scores.
Low cannibalization risk. Highest income and competitor gap scores in the set, underweighted by the model's current traffic factor.
The real shortlist after cannibalization: Sites C and D. The model ranked them #3 and #4, but they're the ones that actually grow the network rather than redistribute it. This decision is only possible because of the trade area polygons built in trade area analysis.
Where This Leads
The scoring model builds the shortlist; cannibalization reorders it. Both run on the same spatial foundation: point geometry for locations, polygon geometry for trade areas, and a hex grid for candidates. Once a site is chosen and opened, the loop continues, its trade area gets built and enriched like every other store's, and its delivery and service coverage feed into route optimization. All three workflows in this series run on that same shared data model: build it once, and each new workflow is an incremental layer rather than a rebuild.