geobi.dev Update: From Map Extraction Tool to Location Intelligence Platform
Two weeks after launch, geobi evolved from a simple OSM extraction tool into a full location intelligence platform with trade area analysis, 200+ Census variables, 16 data connectors, and enterprise features.
Two weeks ago I wrote about geobi.dev, a tool I was building to extract OpenStreetMap data onto a map and export it to CSV and GeoJSON for BI workflows. It worked, but it was simple. Draw a box, pick feature types, export a spreadsheet.
Since then, geobi has turned into something I didn't originally plan for. It went from a map extraction tool to a full location intelligence platform, the kind of thing commercial platforms like Placer.ai and SiteZeus typically charge tens of thousands a year for. And it happened largely through a continuous back-and-forth with Claude Code, Anthropic's AI coding agent.
Here's what changed, what I learned from the process, and where this is heading.
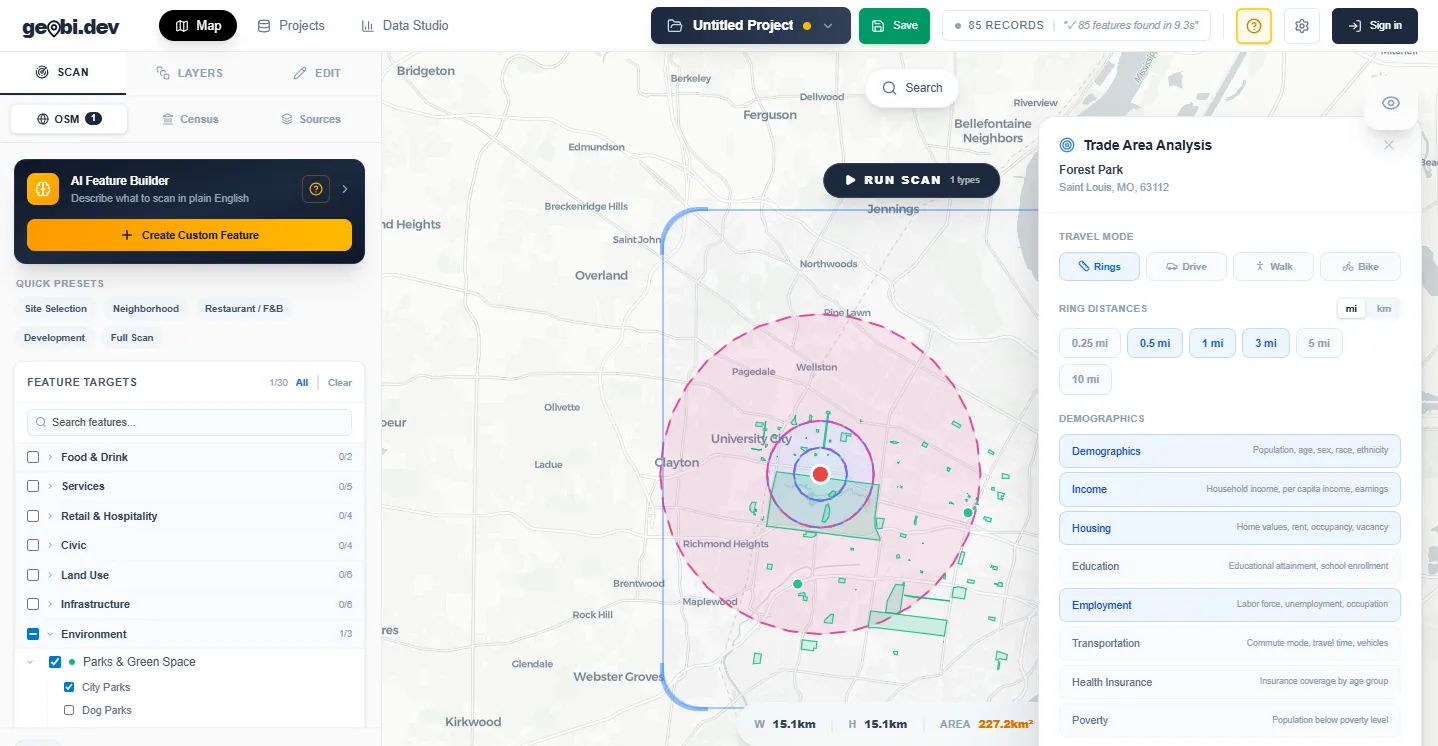
Click to explore geobi.dev
The Map Got Real
The original geobi ran on Leaflet. It worked fine for a few hundred markers, but it couldn't handle heatmaps, data-driven coloring, or 50,000+ features without choking. So I migrated the entire map engine to MapLibre GL JS: GPU-accelerated, WebGL-rendered, and built for the kind of data density that location analytics actually requires.
That migration unlocked everything that came after. The map now supports:
- Heatmaps that show feature density at a glance: where are the clusters of restaurants, the gaps in healthcare coverage, the concentrations of flood risk
- Choropleths that color regions by any numeric property: median income by census tract, population density by ZIP code, home values by neighborhood
- Rich tooltips with formatted property tables on hover, not just a feature name
- A visualization panel to switch between modes and pick which property drives the coloring
This is the difference between "data on a map" and "data you can actually read on a map."
Census Demographics: 200+ Variables, Built In
The original app had basic Census tract lookups. Now it has 200+ demographic variables across 8 categories: income, population, education, housing, employment, age, race and ethnicity, and commute patterns.
When you scan an area and enrich with Census data, each feature gets attributes like median household income, population density, bachelor's degree attainment, owner occupancy rate, poverty rate, whatever you need. The data comes directly from the American Community Survey via the Census API.
This matters because Census demographics are the foundation of every location analytics workflow. Retail site selection, real estate valuation, healthcare access analysis, market research: they all start with "what do the demographics look like here?" Having 200+ variables built in eliminates the need for a separate Census data subscription or manual tract lookups.
Trade Area Analysis
This is the feature that shifted geobi from a data extraction tool into a location intelligence platform.
Pick any point on the map. Define concentric rings: 1 mile, 3 miles, 5 miles, whatever you want. The system generates the ring geometries, identifies which Census tracts intersect each ring, fetches the demographics for every tract, and gives you a structured report: median income per ring, total population per ring, education levels per ring, housing stats per ring.
Commercial platforms like Placer.ai and SiteZeus typically run tens of thousands per year. Their core product is proprietary foot-traffic panel data, which free sources can't replicate, but ring demographics like these are a meaningful slice of what those platforms charge for, and geobi does that slice for $19/month because the underlying data (OpenStreetMap features, Census ACS data, FEMA flood zones) is all free and public. The value is in assembling it into a usable workflow, not in the data itself.
Building this feature also taught me something about working with AI agents on complex backend logic. The first version crashed immediately: MapLibre threw errors because it tried to insert map layers before reference layers that didn't exist yet, and the Census API rate-limited the app because it was firing 200 parallel requests. Claude traced both issues from symptoms to root cause without me pointing at specific lines. It added graceful layer ordering with fallbacks, and a concurrency limiter that batches Census requests in groups of 8. The kind of defensive code I probably wouldn't have written on a first pass myself.
16 Data Connectors
The original app had one data source: OpenStreetMap. Now it has 16:
Government Data
FEMA flood zones, EPA Superfund and TRI sites, HUD Opportunity Zones, BLS employment data, Census Business Patterns, FHFA home prices, FBI crime statistics, NCES school data, IRS income statistics, NOAA weather stations
Commercial & Enterprise
Overture Maps (global chain locations and addresses), OpenChargeMap (EV stations), WalkScore, Snowflake (query with lat/lng mapping), Databricks (full CRUD with Delta Lake write support)
Each connector is a self-contained server route. You select a data source in the scan panel, it fetches the data, and features appear on the map alongside everything else. No downloading shapefiles, no manual geocoding, no format conversion.
The Snowflake and Databricks connectors are specifically for enterprise teams whose data lives in a warehouse. Pull your own locations onto the geobi map, enrich them with Census demographics and trade area analysis, and push the results back to your warehouse. That round-trip is what makes geobi useful as part of an existing BI stack, not just a standalone tool.
Built-in Analytics
I used to think of geobi as a data preparation tool: get the data, clean it up, export it, analyze it somewhere else. But I kept running into the same pattern: users would extract data, export to CSV, open Power BI, build a chart, realize they needed different data, come back to geobi, re-extract, re-export. The feedback loop was too long.
So I built analytics into geobi directly:
- Charts: bar, pie, scatter plots, and histograms rendered in pure CSS and SVG. The scatter plot includes linear regression and Pearson correlation coefficients.
- Data profiling: automatic column type detection, percentile statistics, IQR-based outlier detection, data quality scoring, and cross-column correlation analysis.
- Calculated fields: a formula builder with 8 built-in templates for common location metrics like population density, rent burden ratio, income-to-home-value ratio, and education index.
- Export templates: 8 format-aware templates (Site Selection, Census Demographics, Real Estate Comps, Income Analysis, etc.) that automatically match your data's available fields and tell you the coverage percentage before you export.
The goal isn't to replace Power BI or Tableau. It's to let analysts do their initial exploration and quality checks without leaving the platform. If the data looks right in geobi's charts and profiler, export it with a template and you know it's clean.
Enterprise Features
The moment I started thinking about geobi as a product people pay for, the gaps became obvious. No access control. No audit trail. No API for automation. No way to schedule recurring exports.
- RBAC: admin, editor, and viewer roles with row-level security
- Audit logging: every action gets a timestamped record with user, action type, and metadata
- API key management: generate keys for programmatic access, set rate limits, revoke access
- Webhook integrations: push event notifications to Slack, Teams, or any HTTP endpoint
- Saved views: save and restore specific map configurations per project
- Scheduled exports: set up daily, weekly, or monthly exports that run automatically
None of these are exciting to build. All of them are table stakes for selling to a team that needs governance. An enterprise buyer's first question is never "can it do heatmaps?" It's "who has access, is there an audit trail, and can we integrate it with our existing tools?"
Security Hardening
Building enterprise features forced a security audit. Claude found and fixed:
- SQL injection in the spatial query builder: user-controlled geometry values flowing into raw SQL. Replaced with parameterized queries throughout.
- XSS in map tooltips: feature properties were being injected via innerHTML. Replaced with safe DOM manipulation.
- Unsanitized Databricks connection strings: user input going directly into connection parameters. Added input validation and escaping.
- Sensitive data in logs: user emails and session tokens appearing in server logs. Scrubbed them.
I didn't ask for any of this. Claude found them during the enterprise features session because the context of "make this enterprise-ready" naturally includes "make this secure." This is one of the underappreciated benefits of working with an AI agent: it catches things orthogonal to what you're focused on because it's reading the surrounding code, not just the file you pointed it at.
What I Learned From the Process
"Grade it" is the most useful prompt I've found
Instead of brainstorming features, I asked Claude to evaluate geobi against what a paying customer would expect. The answer was always more actionable than my own feature wishlist because it benchmarked against market expectations rather than my assumptions.
Describe problems, not solutions
"Trade area analysis is crashing" produced better results than "check line 144 of useTradeArea.ts." Claude traced the full path (from button click to API call to map layer insertion) and found two bugs I wouldn't have connected.
The last mile is the whole product
I built 8 backend analytics endpoints in one session. Wiring them to actual UI took equally long. API endpoints without buttons are features nobody knows exist. Always budget equal time for the interface.
Big refactors are where AI agents earn their keep
The Leaflet-to-MapLibre migration touched dozens of files, renamed hundreds of references, and rewired every map interaction. That's a week of tedious, error-prone work for a human. Claude did it in one session because it doesn't lose focus halfway through a 30-file refactor.
Where It Stands Now
geobi.dev is live. The numbers since the last article:
Free tier gives you real scans, real exports, and basic charting. Pro is $19/month and unlocks trade area analysis, census demographics, all AI features, scheduled exports, and warehouse connectors. Enterprise pricing is custom for teams that need governance.
More updates coming. Point clustering, buffer analysis, and additional visualization modes are next on the list.