Building geobi.dev: Spatial Intelligence for the Rest of Us
A deep dive into the architecture, features, and lessons behind a GIS telemetry tool that bridges the gap between complex enterprise platforms and simple mapping widgets.
Geographic data is everywhere: in every delivery route, zoning decision, site selection, and disaster response plan. Yet for analysts and planners, getting that data means either a license that costs as much as the project itself or chasing a chain of exports, scripts, and editing tools. I built geobi.dev because those trade-offs felt wrong.
After years of assembling dashboards and wiring spatial layers into Power BI and Tableau, the same ritual repeated: identify the OpenStreetMap feature, cobble together an Overpass query, export GeoJSON, clean it in QGIS, and then manually join it with business data. It was slow, brittle, and it felt like the client was paying for smoke and mirrors. geobi started as a personal toolkit to cut through that chaos and now keeps a human in the loop while the heavy lifting happens under the hood.
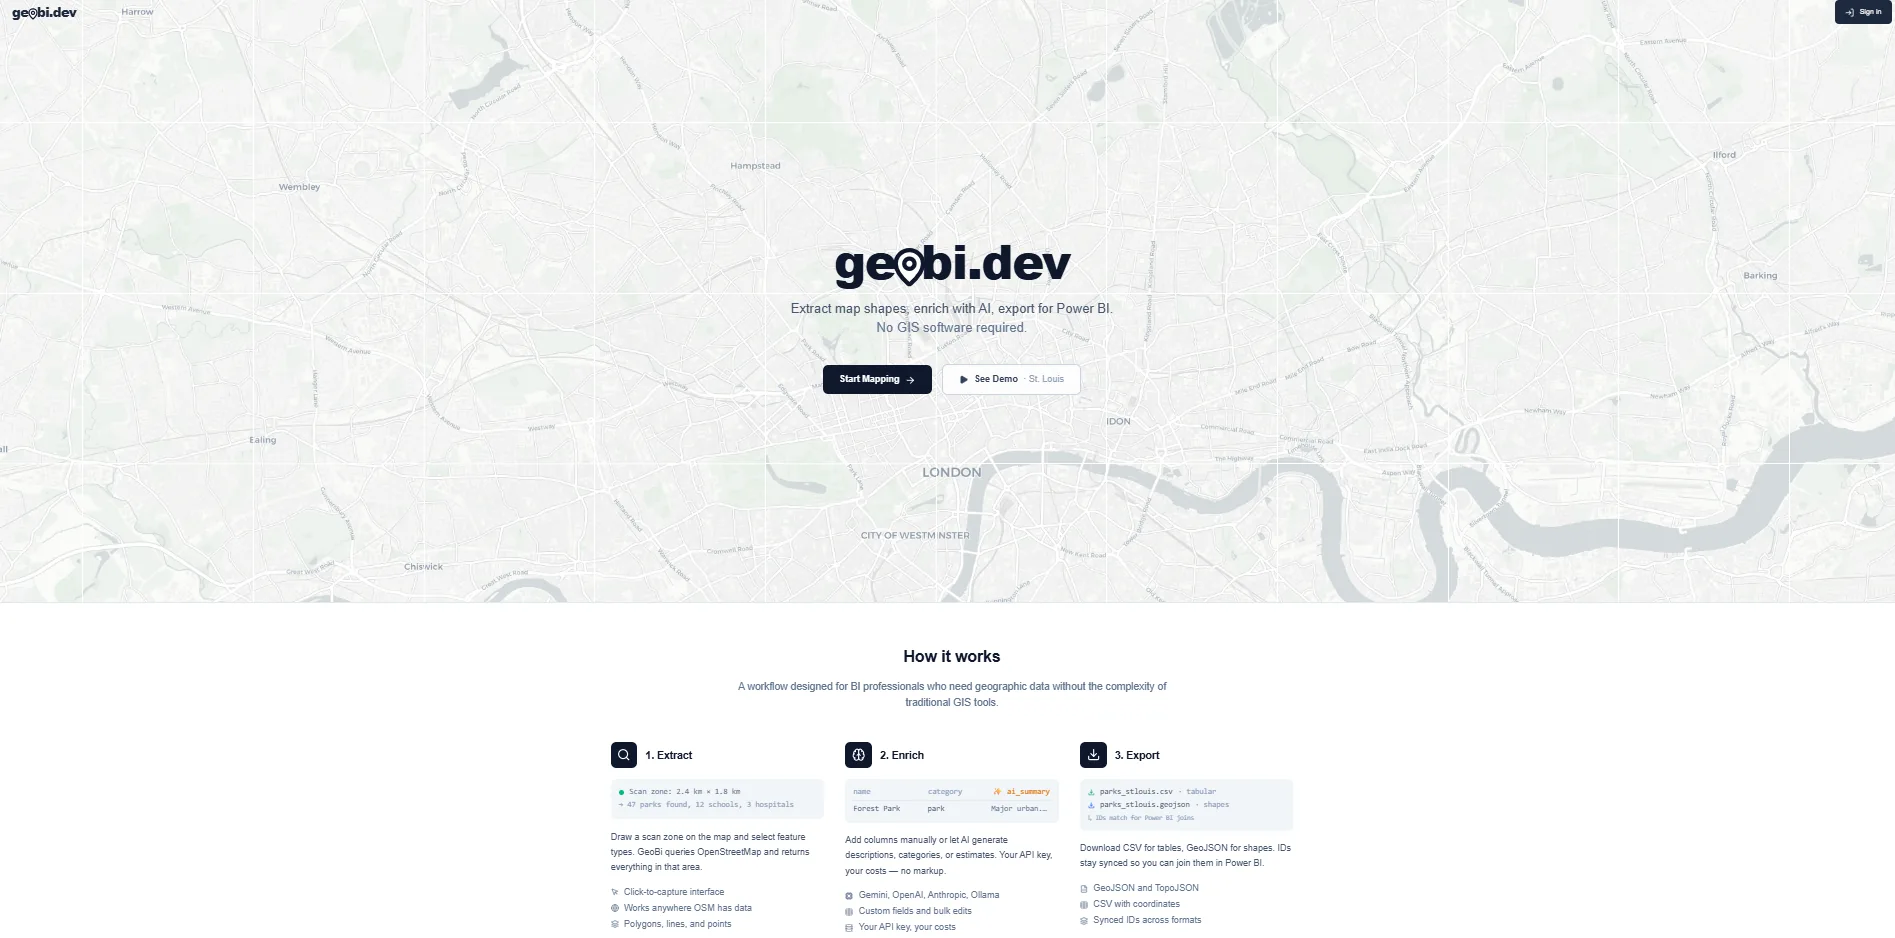
Click to explore geobi.dev
Why It Matters
Every time I tried to add a custom map layer to a Power BI or Tableau report, the work felt like a scavenger hunt. The data existed, but stitching it together required jumping between Overpass Turbo, geometry editors, and troubleshooting messy exports. It was hours of grunt work before the metrics ever breathed.
The typical rhythm went: find a community Overpass query, tweak it to deliver something useful, export GeoJSON, clean edges in QGIS, convert to the format my BI tool wanted, then manually rejoin the cleaned geometry with the business measures. Repeat every week when the geography shifted or the ask changed.
Enterprise GIS platforms solve this with big license checks and consultants, but they also demand heavy maintenance. Simple mapping widgets look nice but only show pins. You still can't trend them, filter them, or drop them directly into your reporting pipeline.
geobi.dev sits between those extremes: powerful enough to survey the geography, nimble enough that an analyst can get results in minutes, and built to export directly into the tools you already use.
How It Actually Works
The workflow starts on the map. Draw a rectangle or free-form polygon to define your zone, name it, and let geobi scan OpenStreetMap within that boundary. You can keep as many zones alive as you like, compare overlapping areas, or decommission them once the story is told.
Behind the scenes, geobi builds Overpass API queries based on the scan profile you choose. Instead of wrestling with Overpass QL, you pick categories and sub-categories, and the platform translates them into precise queries that target the right OSM tags. The response arrives as structured GeoJSON, lands in PostGIS, and is immediately ready for shaping.
Once the geometry is secured, an AI layer powered by Google Gemini can enrich the dataset with context (walkability scores, demographic summaries, proximity triggers) and even translate natural-language questions into spatial filters. You can ask, “Show me coffee shops within walking distance of the convention center with seating,” and Gemini translates that intent into both the query and the feature definition.
Front-Row Features
Maps that obey your workflow
The map is the command center. Built on Leaflet with OpenStreetMap tiles, it lets you draw multiple scan zones, rename them, and check distances or areas before committing to a query. Measurement tools make sure the geography you’re about to scan actually matches what you need.
Profiles that stay focused
Scan profiles are grouped into categories like amenities, transportation, land use, and natural features. Each expands into detailed sub-categories tied to precise OSM tags, so you can toggle on exactly what matters and keep the result set tight.
AI Feature Builder
Need a custom feature definition? Describe it in plain English (“buildings taller than three stories near transit stops”) and Gemini generates the Overpass query and profile. The new definition slots straight into the scan workflow so you can mix AI-generated and curated features in the same run.
Data Studio
Every scan lands in the Data Studio, a spreadsheet-style interface for reviewing and shaping each feature. Rows represent geographic features with properties and geometry. Sort, filter, rename columns, and delete what you don't need. The experience feels more like Excel than a GIS tool because the audience is analysts, not cartographers.
Export anywhere
The goal is getting data out. Export formats include CSV for spreadsheets, GeoJSON for web mapping, TopoJSON for visualizations, and zipped Shapefiles for tools like Power BI’s shape map visual. Every export preserves the geometry and properties you shaped in the studio.
Under the Hood
geobi is a full-stack effort with deliberate decisions driven by the complexity of spatial data. Here’s why each piece matters.
React + TypeScript + Vite
The frontend is a React 19 + TypeScript single-page app built with Vite. Spatial data is complex, so TypeScript helps lock in shapes and prevent runtime surprises. Vite keeps the edit-refresh loop tight even with heavy mapping bundles.
Leaflet + OpenStreetMap
After testing Mapbox GL and Deck.gl, Leaflet won for its lightweight footprint and plugin ecosystem. I serve OpenStreetMap tiles directly (no API key, no vendor lock-in), though OSM's tile usage policy limits heavy production use, so at scale the right move is a commercial tile provider or self-hosted tiles. Leaflet Draw handles edit controls, measurement tools keep everyone honest, and custom controls manage layer toggles.
Express.js + PostgreSQL + PostGIS
The backend runs on Express with PostgreSQL and PostGIS. PostGIS is the workhorse, turning complex geometry queries into single SQL statements. Spatial joins, distance calculations, and CRS transforms live in the database so the application layer stays focused on shaping results.
Overpass API
Instead of mirroring OpenStreetMap, geobi queries Overpass on demand. The scan profile builder batches tags into union queries, minimizes round trips, and stays within fair-use limits by caching responses and respecting rate limits.
Google Gemini
Gemini handles enrichment, natural language search, and feature creation. Each request includes the scan bounds, existing sample features, and tag schemas so the model stays grounded in the actual geography.
Deployment on Replit
The entire stack (React, Express, PostgreSQL + PostGIS) deploys on Replit as a single unit. Push to Replit, and the app is live with the custom domain geobi.dev. Keeping development and production on the same platform reduces DevOps friction while staying reliable.
Design Philosophy
geobi follows an executive newsprint aesthetic: clean typography, muted tones, and a dense information hierarchy. That keeps the experience focused for data people who need spatial capabilities without the clutter of traditional GIS interfaces. Controls appear when they matter and disappear when they do not.
Mobile responsiveness was non-negotiable because insights don’t always happen at a desk. Whether you’re in the field or on a commute, the map and Data Studio adapt. Scan zones are touch-friendly, and the studio collapses into cards on narrow screens.
Lessons from the Build
PostGIS changed everything
Before PostGIS, I wrote spatial math in JavaScript: point-in-polygon checks, distance calculations, bounding box joins. It worked, but it was slow and fragile. Once I let PostGIS carry that load, spatial joins that took seconds in JS took milliseconds with a GiST index. Lesson: if your data is spatial, your database should be spatial too.
API costs add up fast
Google Places gives rich metadata, but the bill climbs fast. I kept Overpass as the primary data source (free, comprehensive, community-maintained) and layered Google Places on top as an optional, premium boost for those who need it.
AI needs guardrails in spatial context
Early Gemini runs returned millions of features or confused context. The fix was grounding: always pass scan bounds, sample features, and explicit query limits in the prompt. LLMs are capable at spatial reasoning, but they need the right anchors.
Iterating fast with AI-assisted development
geobi was built with AI help: scaffolding React components, generating PostGIS migrations, debugging Overpass edge cases. The architectural decisions, data model design, and UX choices remain human, but the velocity of turning them into working code is where AI added the most value.